Agent workspace
Reports
Reports summarise the workspace over a window you choose: six headline numbers, a few charts, a per-agent table, and a CSV export of the lot.
Choosing the window
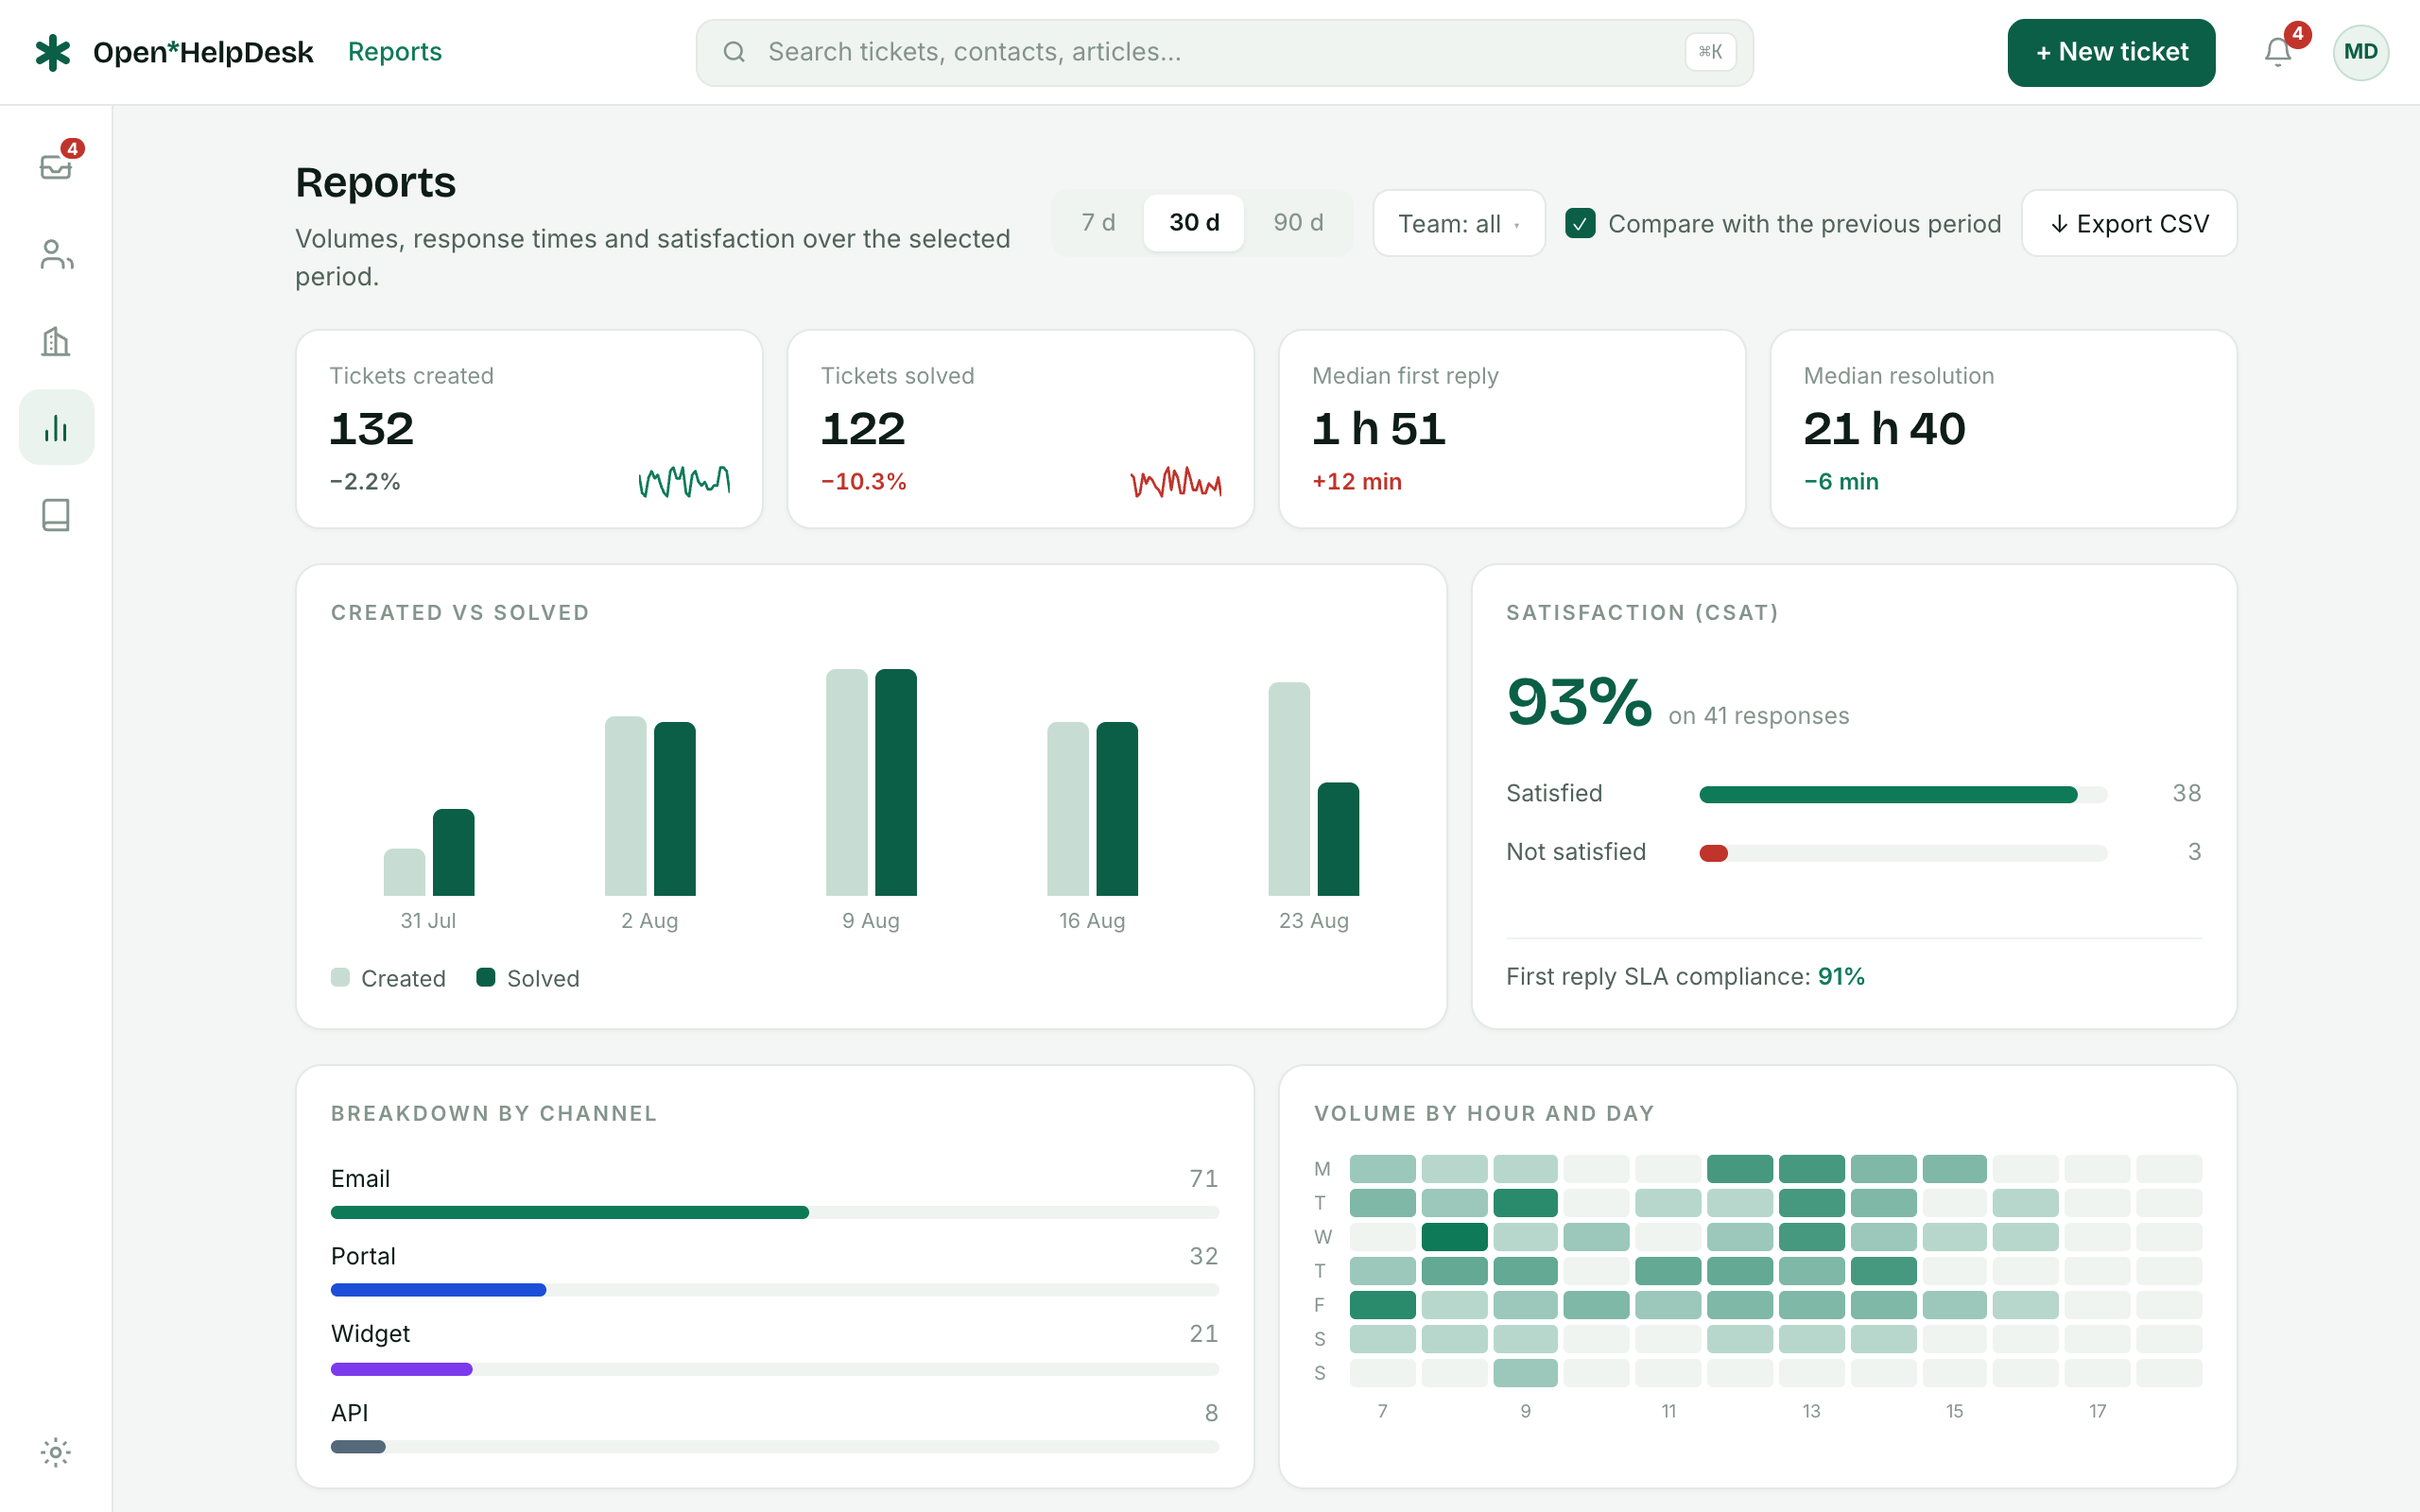
The toolbar picks the period — 7, 30 (the default) or 90 days — and optionally filters to a single team. The Compare with the previous period toggle turns on the deltas: with it on, each number shows how it moved against the window of the same length just before. A banner warns you when the workspace holds fewer than seven days of data, since trends are still noisy that early.
The KPIs
Four of the six figures are tiles across the top; SLA compliance and CSAT read together in the satisfaction card, since one explains the other.
- Tickets created
- How many tickets opened in the window.
- Tickets solved
- How many tickets were marked solved in the window.
- Median first reply
- The typical wait for a first agent reply.
- Median resolution
- The typical time from opening a ticket to solving it.
- SLA compliance
- The share of solved tickets that met their deadlines.
- CSAT
- The share of customer ratings that were positive.
Median, not mean
The two time metrics — Median first reply and Median resolution — use the median, not the average. The median is the middle value: half of the tickets in the window were faster, half were slower.
This matters because response times are lopsided. A mean would be dragged upward by a handful of tickets that sat over a weekend or waited days on the customer, and would report a typical experience far worse than most people actually got. The median ignores how extreme those few outliers are and reports the ticket in the middle, which is closer to what a normal request looks like.
Reading SLA compliance
SLA compliance is the share of the tickets solved in the window that met their deadlines. A ticket counts as compliant when it answered on time and resolved on time; missing either deadline makes it non-compliant. A ticket that had no deadline set counts as compliant, since there was nothing to breach.
Two things follow from that definition. The denominator is tickets solved in the period, not tickets created — a still-open ticket does not count yet, in either direction. And when nothing was solved in the window, the tile shows a dash rather than 0%, because a percentage of nothing would be misleading.
Charts and the agent table
Below the tiles the same window is broken down four ways:
- Created vs solved — the two counts plotted day by day, so you can see whether you are keeping up with inflow.
- Breakdown by channel — where tickets came from: email, portal, widget or API.
- Volume by hour and day — a heatmap of when tickets arrive across the week.
- Performance by agent — a table of tickets solved, median first reply and CSAT for each agent.
CSV export
Export CSV downloads the numbers behind the screen for the current period and team. The file holds the KPI block (each indicator with its current and previous period), the day-by-day created and solved series, and the per-agent breakdown. Columns are separated by semicolons and the file is UTF-8:
Indicator;Current period;Previous period
Tickets created;128;115
Tickets solved;121;110
…
The export mirrors whatever the toolbar is set to, so change the period or team first, then export. To act on what the numbers point to, head back to the inbox and its views.